Powerful Features
Everything you need for comprehensive section design and analysis.
Cross-Section Modeling
Create any cross-section with precision. Define reinforced concrete section of any shape and complex composite sections with complete control over geometry and reinforcement placement.
- 50+ parametric shapes including solid, hollow, and flanged sections
- 3000+ standard steel shapes for composite columns
- Automatic calculation of section properties
- Confinement zone definition for seismic design
Quick Design Wizard
Quick Design Wizard is CSiCol's streamlined interface that appears when you start the program, designed to guide users through the entire column design process from start to finish. This comprehensive tool provides centralized access to all forms needed for creating, analyzing, and generating results for column models, making the design process simple, organized, and efficient.
- All design forms accessible from single wizard interface
- Creates rectangular or circular columns with custom parameters
- Load combination definition for analysis
- Immediate access to capacity ratios and interaction diagrams
Confinement
Confinement in CSiCol can be applied through two methods: Auto Confinement uses the button to automatically generate a confinement zone that encloses the outer perimeter of rebars for rectangular or circular patterns. Manual Confinement allows drawing confinement zones manually at desired locations within the section.
- Confined concrete exhibits significantly increased compressive capacity
- Improved ductility
- Seismic performance
- Tie diameter and spacing
Auto Design Functionality
The Auto Design feature in CSiCol is a powerful, iterative optimization tool that automatically determines the minimum reinforcement required to satisfy user-defined design criteria.
- Automatically finds minimum reinforcement satisfying design
- User controls bar sizes, spacing, and ratios
- Maintains existing pattern or adds bars automatically
- Allows bundled bars when single bars insufficient
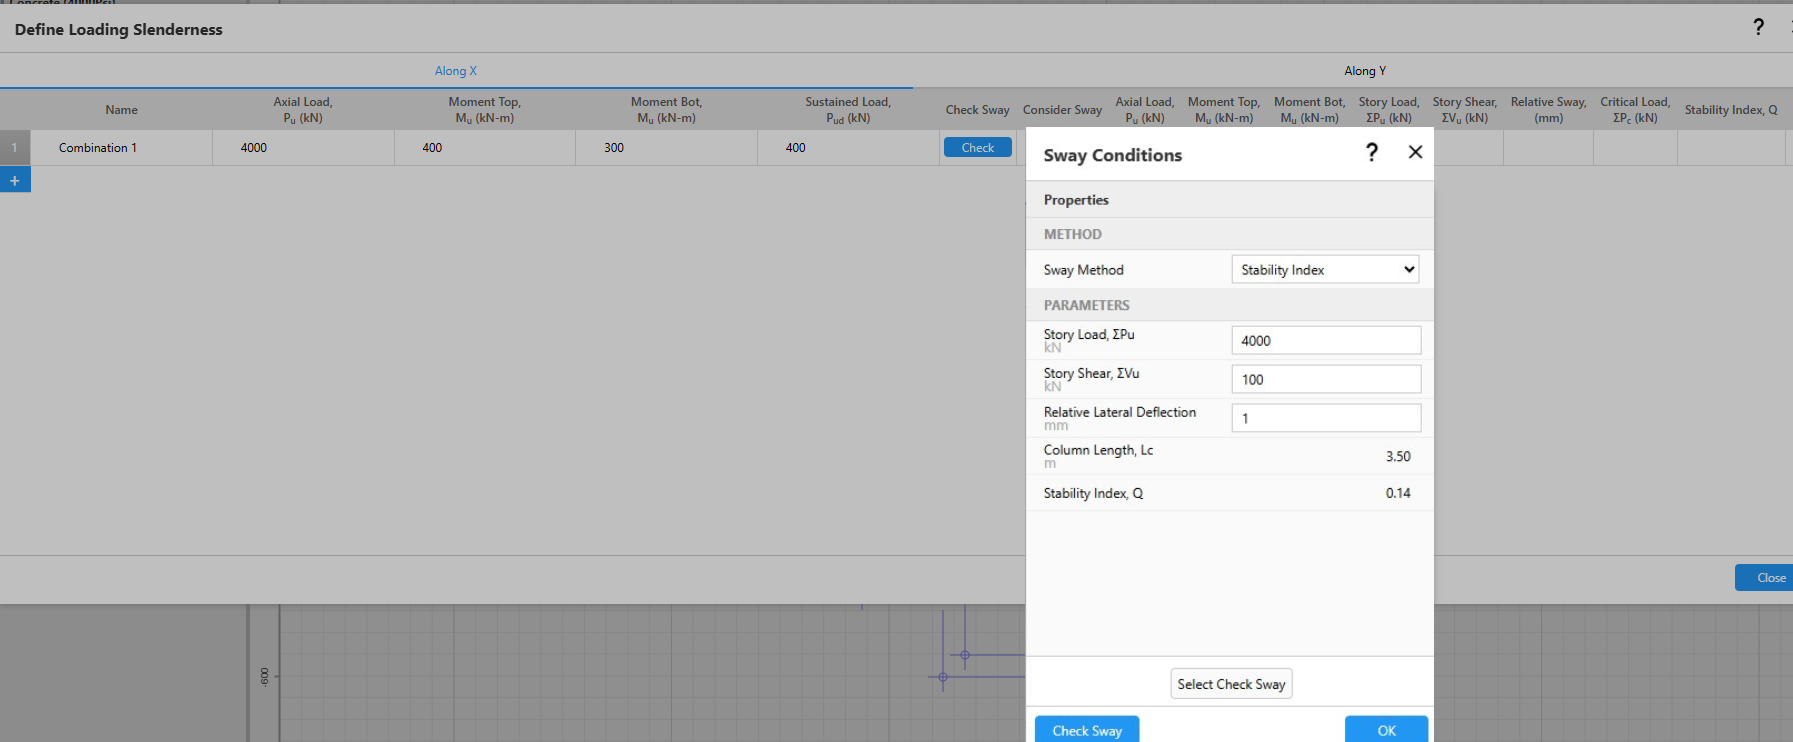
Slenderness Effects
Slenderness effects account for the additional moments induced in columns due to lateral deflections under axial load, a phenomenon known as second-order or P-Delta effects that can significantly reduce column capacity if not properly considered. CSiCol provides comprehensive tools for analyzing slender columns by calculating magnified design moments in accordance with various international design codes, ensuring that columns are adequately designed for second-order effects.
- Determines sway versus non-sway conditions systematically
- Calculates amplified moments for both loading directions
- Computes K-factors based on framing conditions
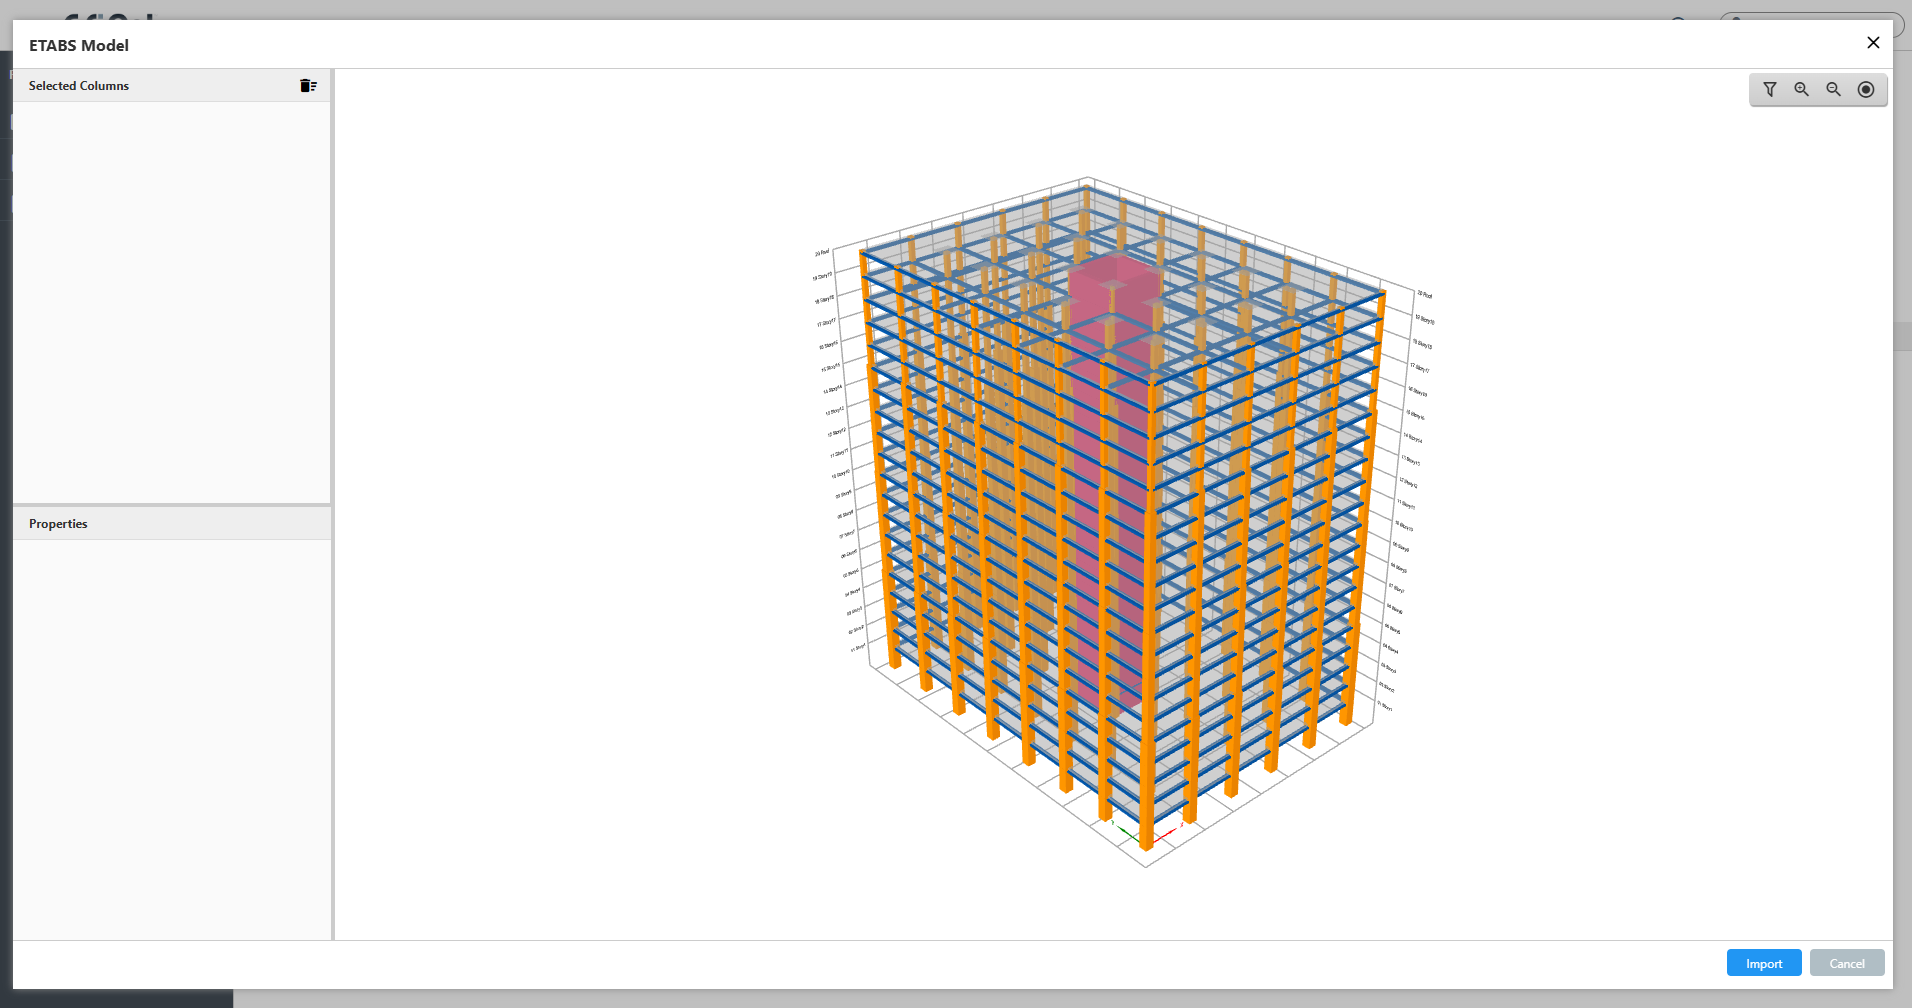
ETABS Model Import
Import ETABS Model feature provides comprehensive integration with ETABS building analysis software, allowing engineers to extract complete column definitions including geometry, materials, reinforcement layouts, framing conditions, and load combinations directly from ETABS model files.
- Imports geometry, materials, rebars, framing, and loads simultaneously
- 3D building display with filtering by section and story
- Handles unit conversions, cover definitions, and code versions intelligently
Compatibility with CSiCol v9
CSiCol files saved in version 9 (.cdb files) can be imported to CSiCol newer version. Multiple columns can be imported, and the columns are imported along with their framing conditions, loadings, material assignments and slenderness properties. By default, the working units will be the same as that used in the older version of CSiCol.
- Open and edit CSiCol v9 files directly
- Preserve all design parameters

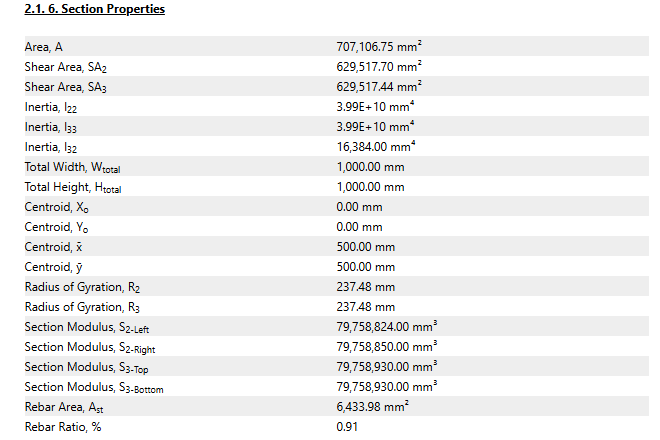
Section Properties
CSiCol provides comprehensive section property calculations. The Section Properties form organizes results into four logical categories.
- Basic Properties (area, shear areas, moment of inertia, and torsional constant)
- Additional Properties (radii of gyration and section moduli)
- Rebar Properties (total reinforcement area and reinforcement ratio)
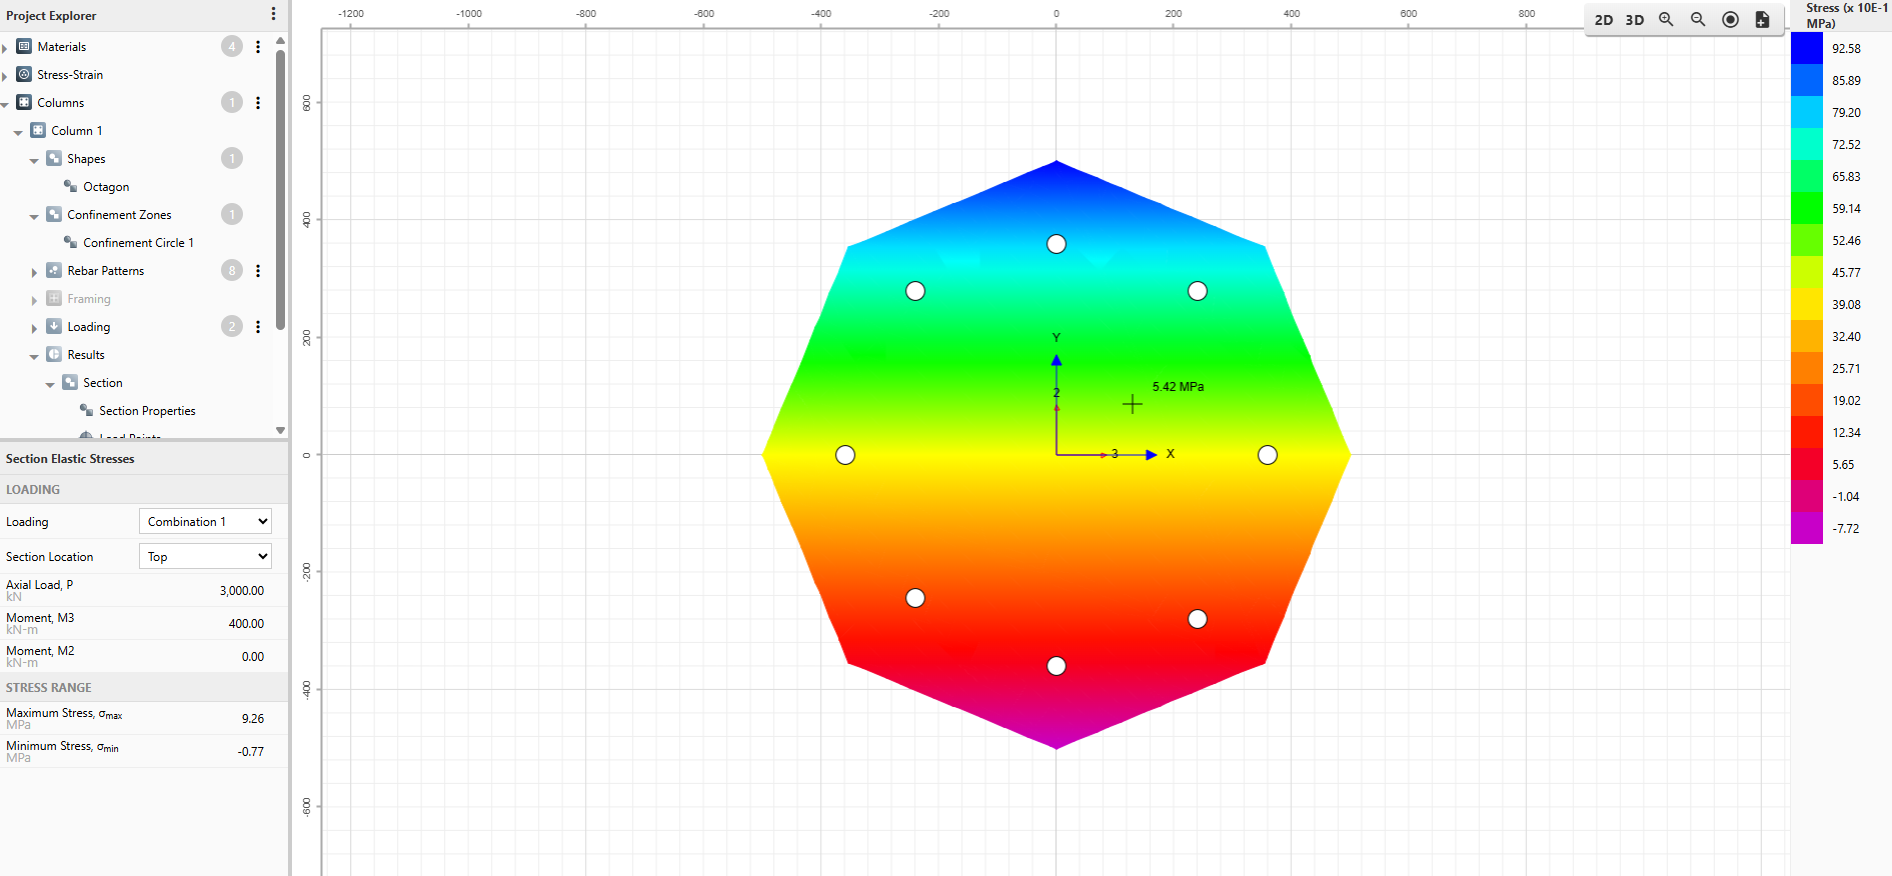
Section Stresses
CSiCol displays flexural stress distribution resulting from applied loads on column cross-sections through sophisticated 2D and 3D color-coded contour visualization.Users can select any specific loading and section location (top or bottom) from the Section Elastic Stresses grid to view the corresponding stress pattern across the entire cross-section.
- Toggle between 2D and 3D stress contour displays
- Hover cursor over any point to read exact stress values
- Add stress contours directly to detailed design report
Interaction Diagram
The Interaction Diagram is CSiCol's primary tool for visualizing column capacity under combined axial load and biaxial bending. It displays the three-dimensional capacity surface formed by axial load (P) and moments (M2, M3), along with two-dimensional slices showing P-M and M-M relationships. This feature helps engineers quickly verify if applied loads fall within safe capacity limits and understand section behavior under various loading conditions.
- 3D color-coded surface shows complete capacity envelope
- P-M curves display load-moment interaction at angles
- M-M curves show biaxial bending at load levels
Animate Interaction Diagram
The Animate Interaction feature provides a dynamic visualization of how the capacity surface is generated as the neutral axis rotates through different angles. This animation shows the progressive development of the P-M interaction curves and capacity surface, helping users understand the underlying mechanics of column capacity calculation.
- Dynamic visualization of capacity surface generation process
- Shows neutral axis rotation through different angles
- Includes Play/Stop and zoom controls for viewing
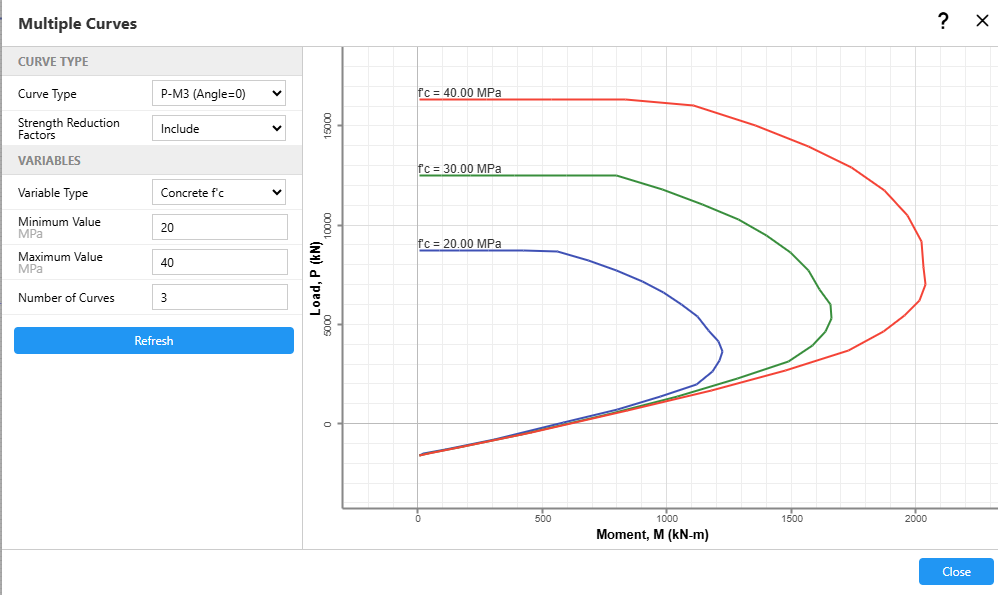
Multiple PM Curves
The Multiple Curves feature enables simultaneous plotting of several P-M or M-M interaction diagrams on a single graph while systematically varying critical design parameters. Engineers can compare how changes in concrete compressive strength (f'c), steel tensile strength (fy), or rebar sizes impact the column capacity envelope. This comparative analysis tool helps designers quickly determine the most efficient strategy for increasing section capacity when designs prove inadequate for specified load combinations.
- Simultaneously plot multiple P-M or M-M diagrams
- Vary concrete strength, steel strength, or rebars
- Identify most effective capacity enhancement strategies efficiently
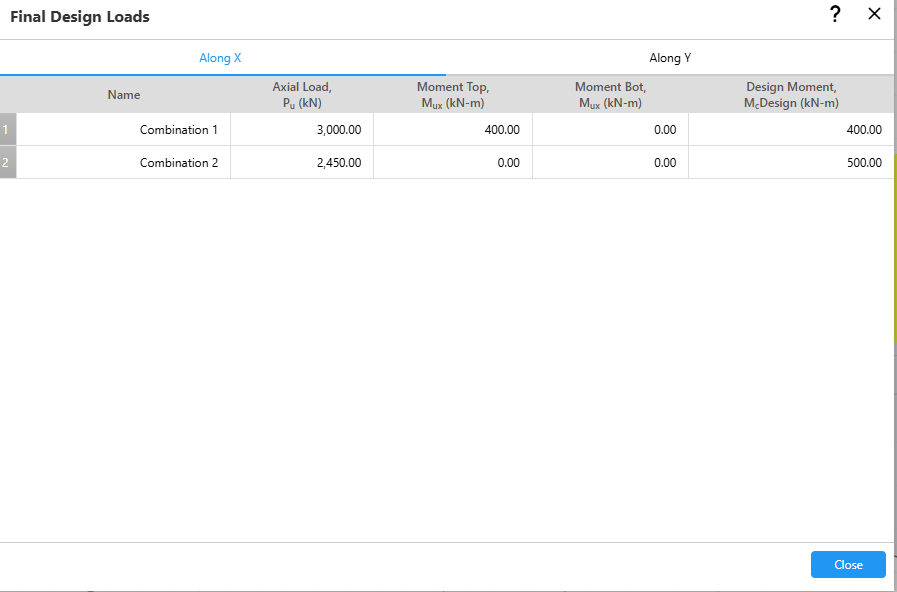
Design Loads
The final design loads are different from the user input loads in case of slender columns as they need to be modified to account for second order effects. Select the loading direction (Along X or Along Y) by clicking on the respective tab to view the loading in the desired direction. The moments under Along X and Along Y tab correspond to the moment about the X-axis and the Y-axis respectively.
- Shows final loads including slenderness magnification effects
- Separate tabs display X-direction and Y-direction loading
- Documents all load combinations for design verification
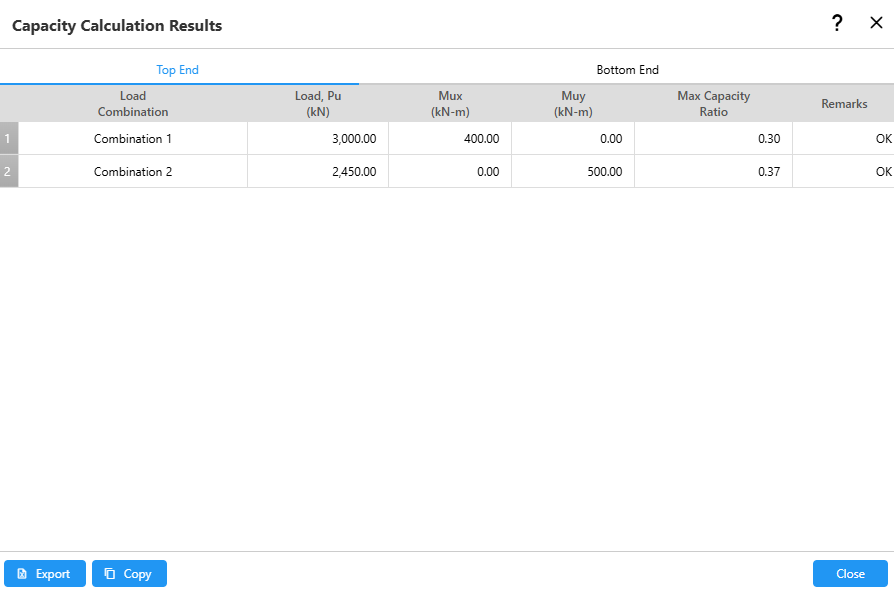
Capacity Ratios
The maximum of the capacity ratios calculated from different methods for the bottom and top ends of the section are displayed in two separate tabs. It also displays whether the section is adequate for each load combination or not. For maximum capacity ratios greater than one, the software reports the section as inadequate.
- Displays separate results for top and bottom ends
- Reports section adequacy for all load combinations
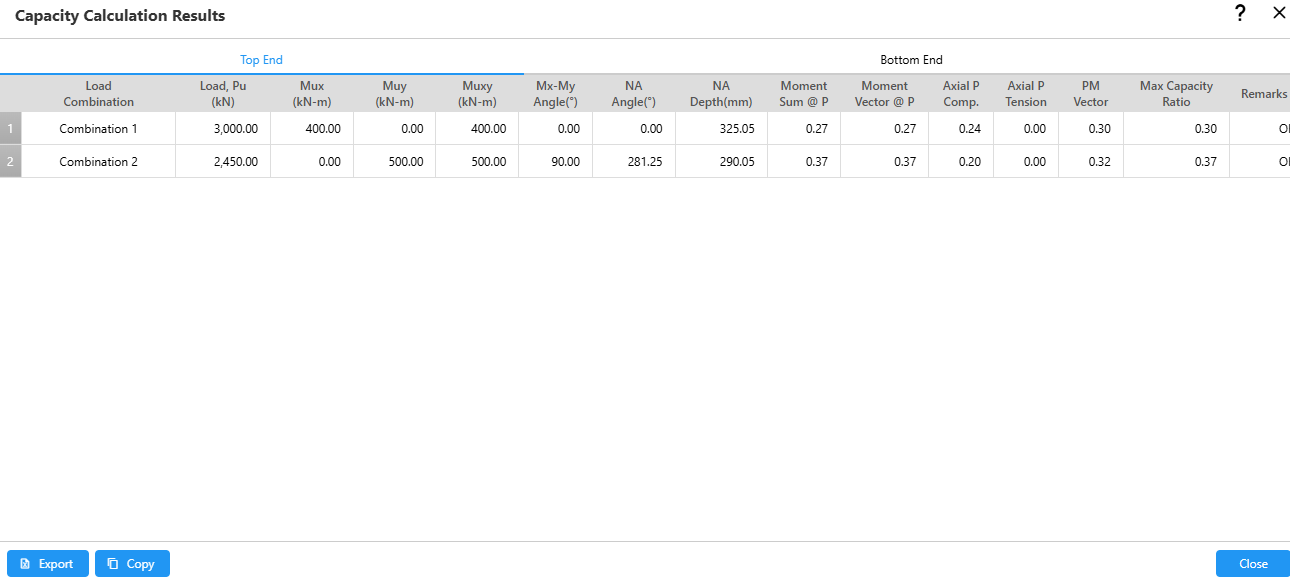
Detailed Results
The Detailed Results displays some additional results besides the maximum capacity ratios such as the resultant moment and resultant moment angle.
- The output can be exported to an Excel file
- The output can be copied to the clipboard
- The capacity ratio is calculated from the interaction surface with the capacity reduction factors included
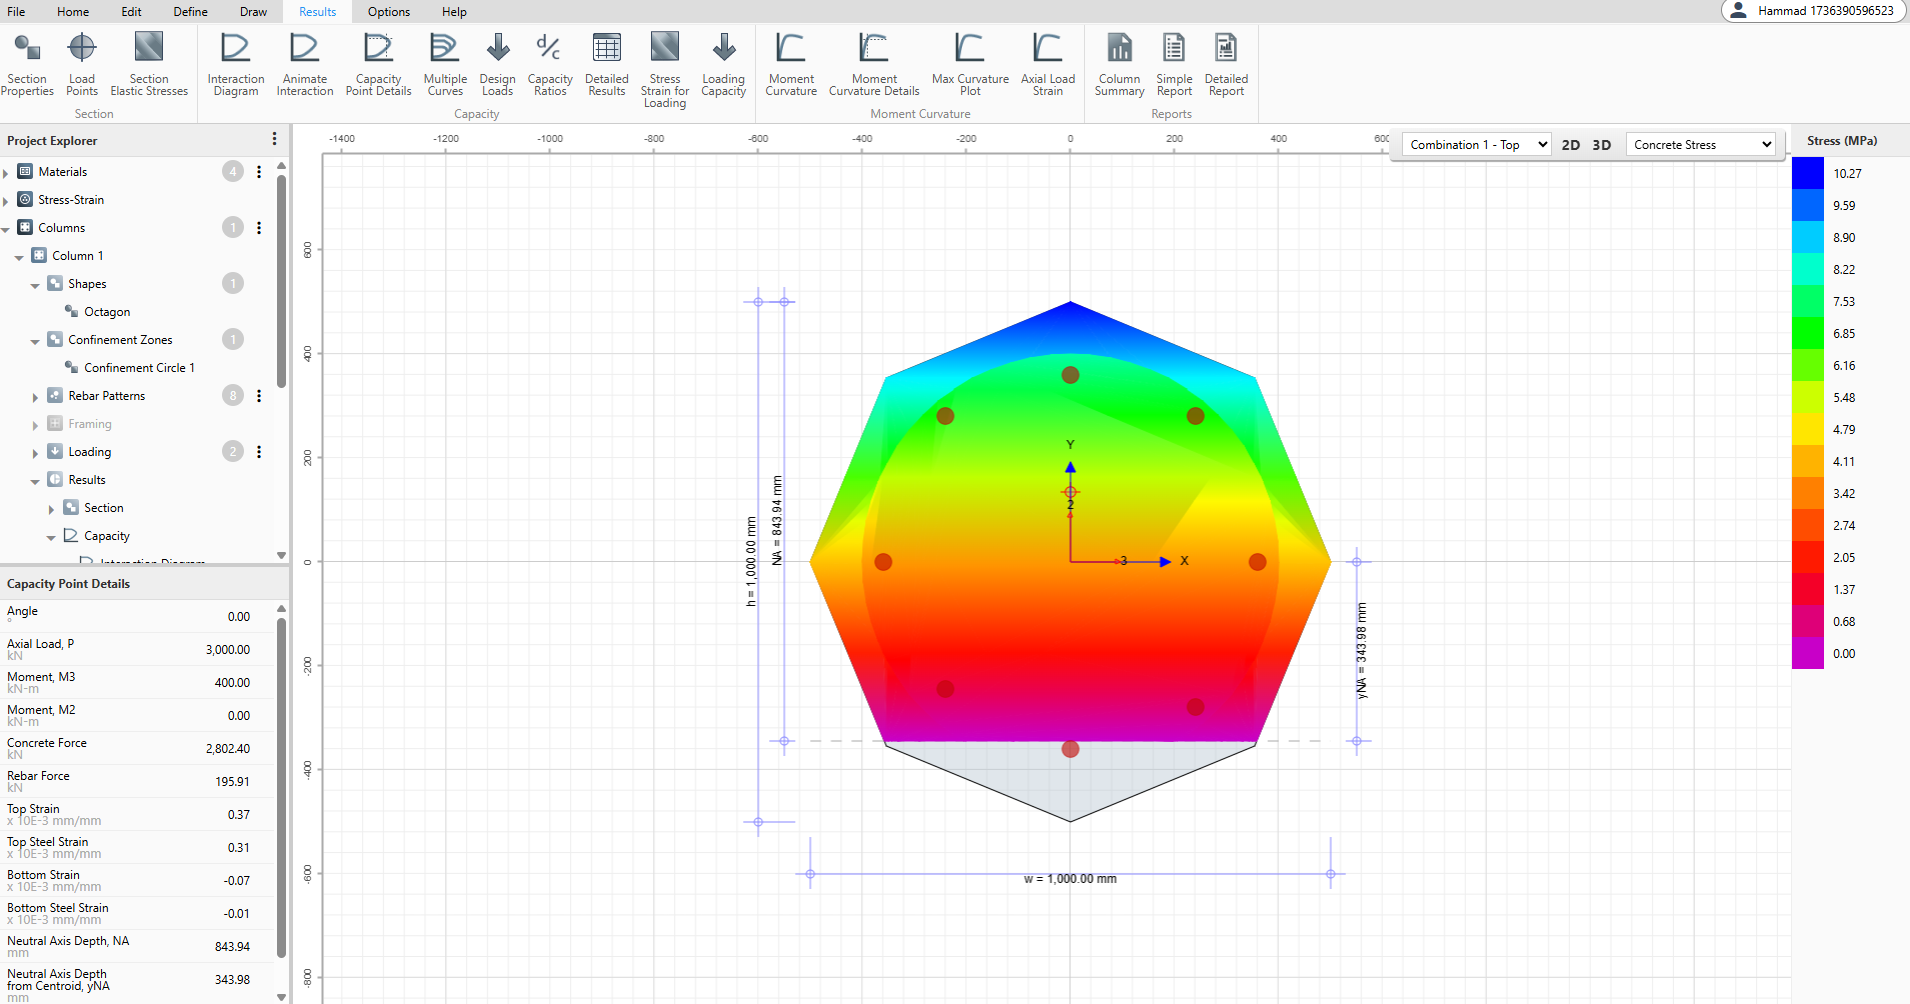
Stress Strain for Loading
The Stress Strain for Loading feature visualizes the stress and strain distribution across the column section for a selected load combination. This tool displays color-coded contours showing stress/strain patterns in both concrete and reinforcement, while also indicating the orientation and location of the neutral axis.
- Shows concrete and rebar stress/strain contours visually
- Displays neutral axis orientation and location clearly
- Offers 2D or 3D views for analysis
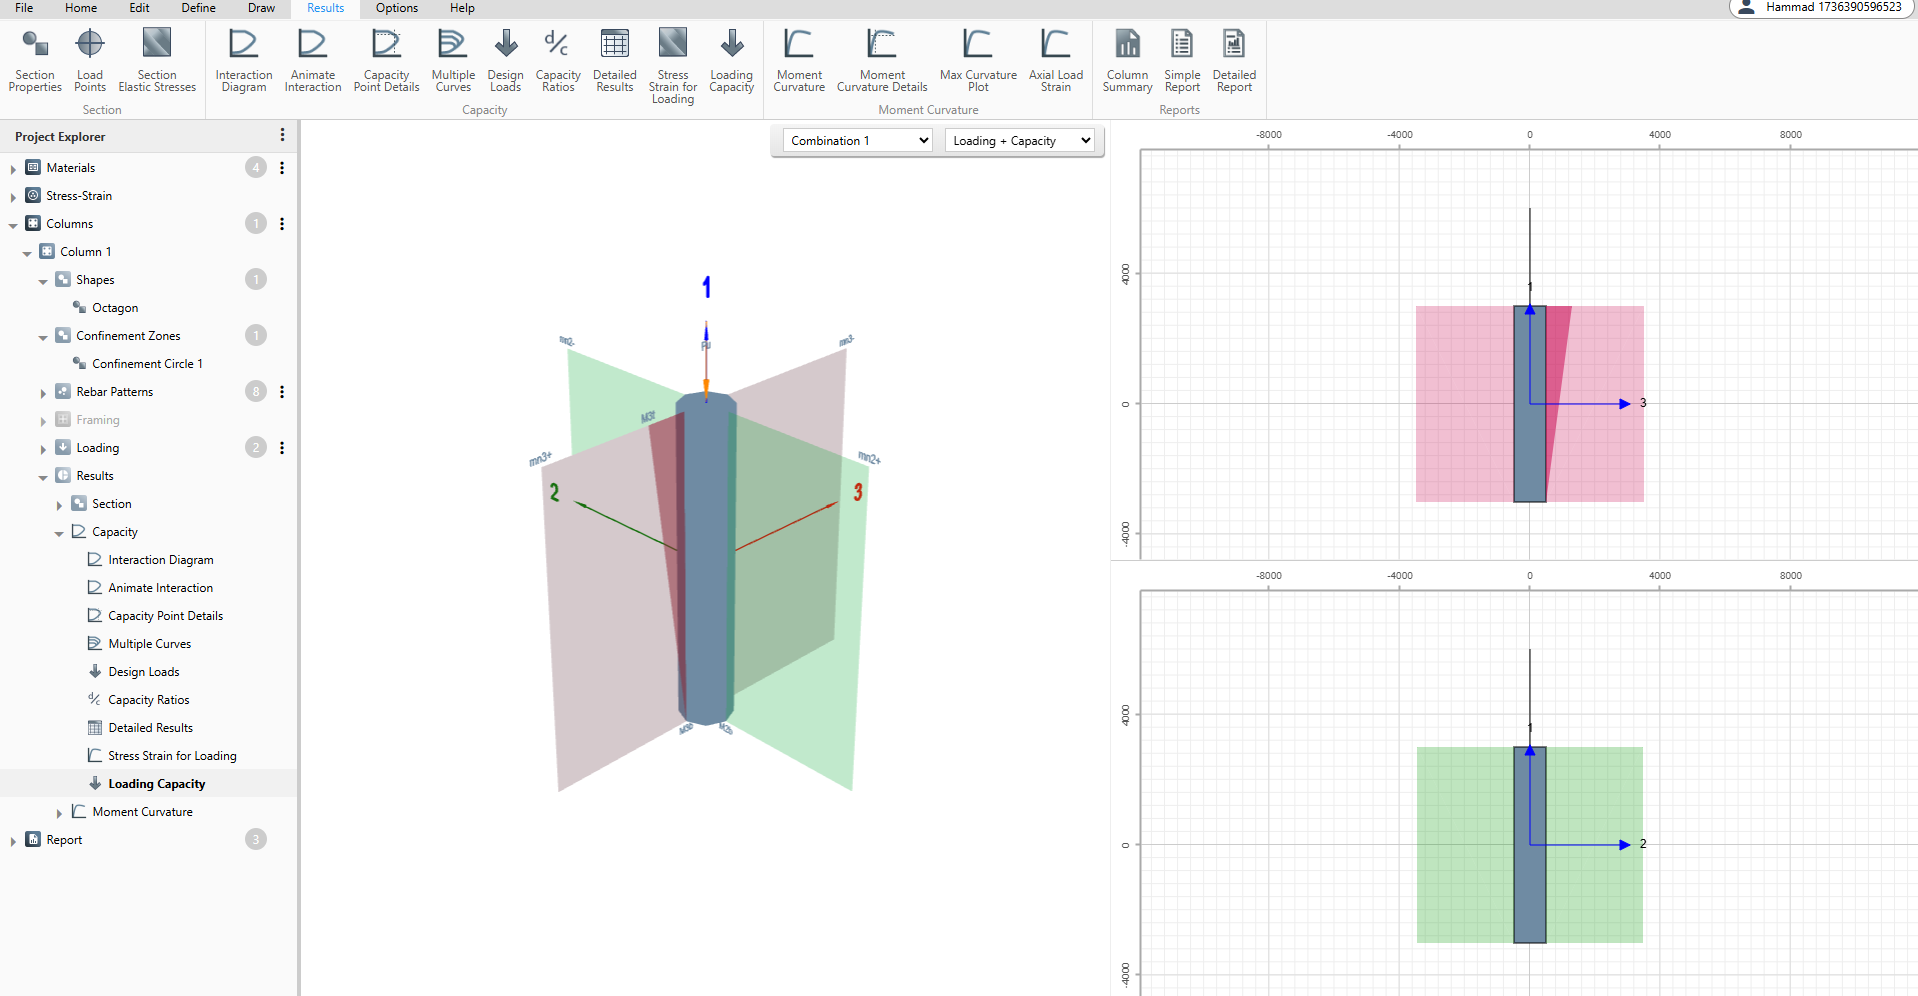
Loading Capacity
The Loading Capacity feature provides a visual comparison between applied loads and the section's capacity envelope in both three-dimensional and two-dimensional views. This tool allows engineers to see how the actual loading vector relates to the capacity surface, making it easy to assess the adequacy and reserve capacity of the column section. Users can select specific load combinations and choose to display loading alone, capacity alone, or both simultaneously for comprehensive evaluation.
- Visual comparison of loading versus capacity envelope
- Available in both 3D and 2D views
- Toggle display between loading, capacity, or both
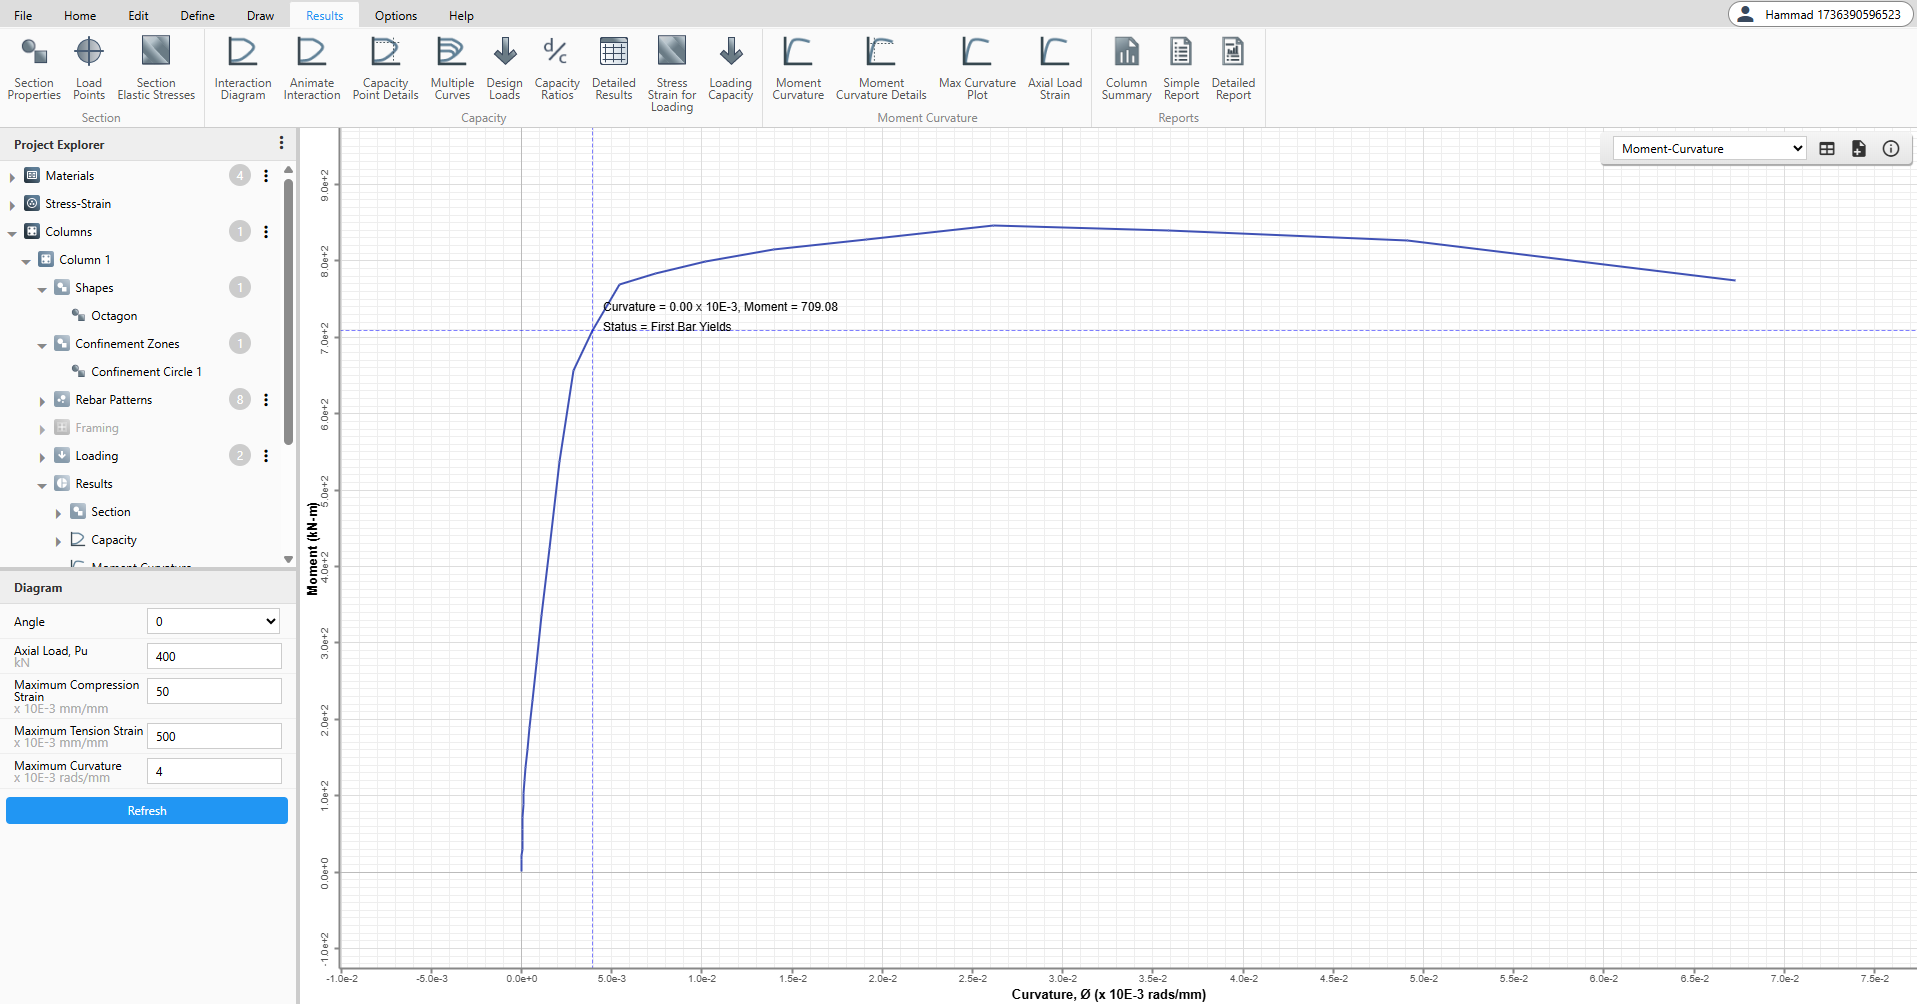
Moment Curvature
Moment curvature diagram is the graphical representation of moment resistance at a section with respect to the curvature. A moment-curvature diagram obtained from the stress resultants are independent of the member geometry or the bending moment diagram and for a specified axial load, it is the property of the cross-section.
- Important input for nonlinear static and nonlinear dynamic analyses
- Determination of the rotational capacity of plastic hinges
- Basis for the capacity-based and performance-based design methods
Moment Curvature Curve Types
CSiCol offers seven different curve types within the Moment Curvature feature, each providing unique insights into section behavior under loading. Users can select any curve type from the dropdown menu to visualize different relationships between curvature and structural response parameters.
- Initial loading through failure
- Including force distribution
- Strain development
- Neutral axis movement
Moment Curvature Details
The Moment Curvature Details feature provides point-by-point analysis of the moment-curvature relationship, displaying comprehensive information as you hover along the curve.
- Shows force, moment, and curvature values
- Displays strain and neutral axis depth
- Includes visual stress/strain contours for points
- View critical points on the curve
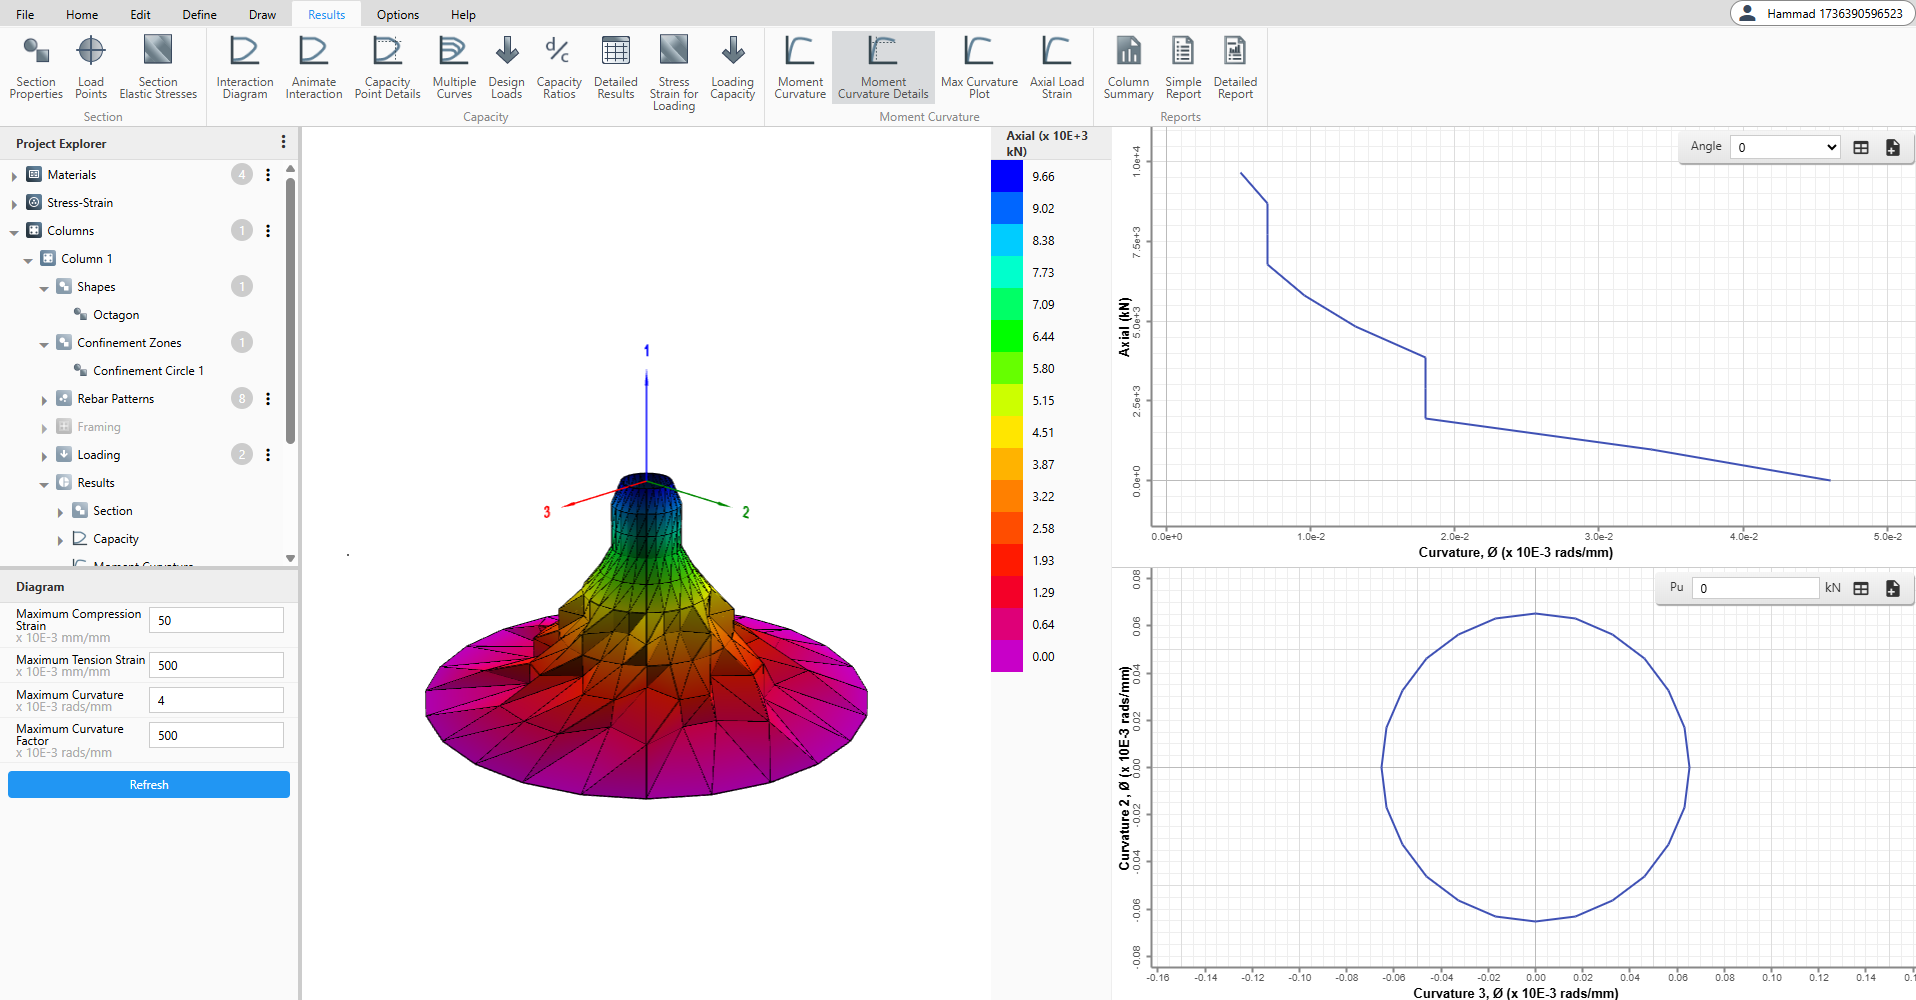
Max Curvature Plot
The variation of all three parameters governing the maximum curvature surface (axial load, curvature 2 and curvature 3) is plotted in a color-coded 3D graph. This gives an overall picture of the variation of all three parameters for the given column section. Axial load is plotted along the vertical axis and curvatures along two orthogonal horizontal axes. A color-coded key is displayed at the extreme right of the section to help interpret the axial load values.
- 3D surface shows axial load vs curvatures
- Axial load-curvature curves at specified angles
- Curvature-curvature plots at constant axial loads
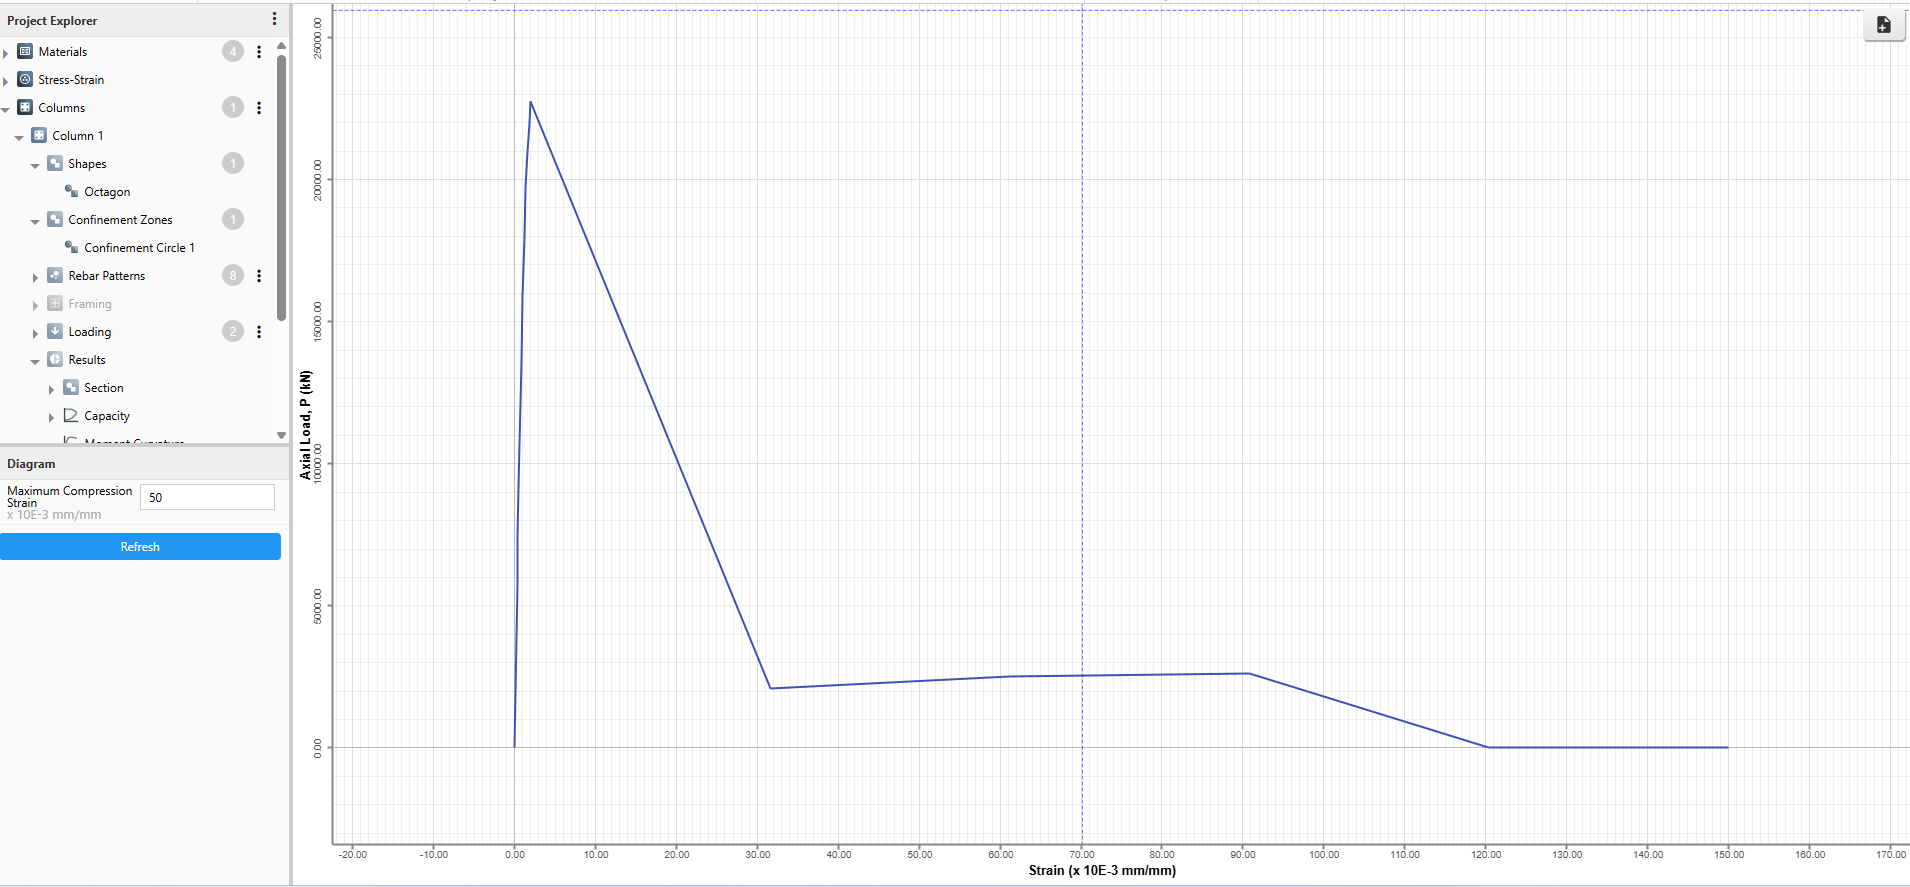
Axial Load Strain Plot
The Axial Load Strain Plot displays the relationship between axial load capacity and strain in the column section, providing insight into the section's behavior under pure axial loading conditions.
- Plots axial load versus strain curve
Create Your Customized Report With Just One Click
Simple Report
- Section properties
- Material properties
- Reinforcement configuration
- Design Load combination
- Visual representation of the column cross-section
- P–M interaction diagram
- M–M interaction diagram
Detailed Report
- Project Information
- Material properties
- Stress-Strain Models
- Section Properties
- Reinforcement Configuration
- Loading
- Design Load Combination
- P–M interaction
- M–M interaction
- Section Elastic Stresses
- Capacity Point Details
- Moment Curvature
- Axial Curvature
- Axial Load
- Column Summary
- Capacity Ratio